
Capability case study
Admin Dashboards
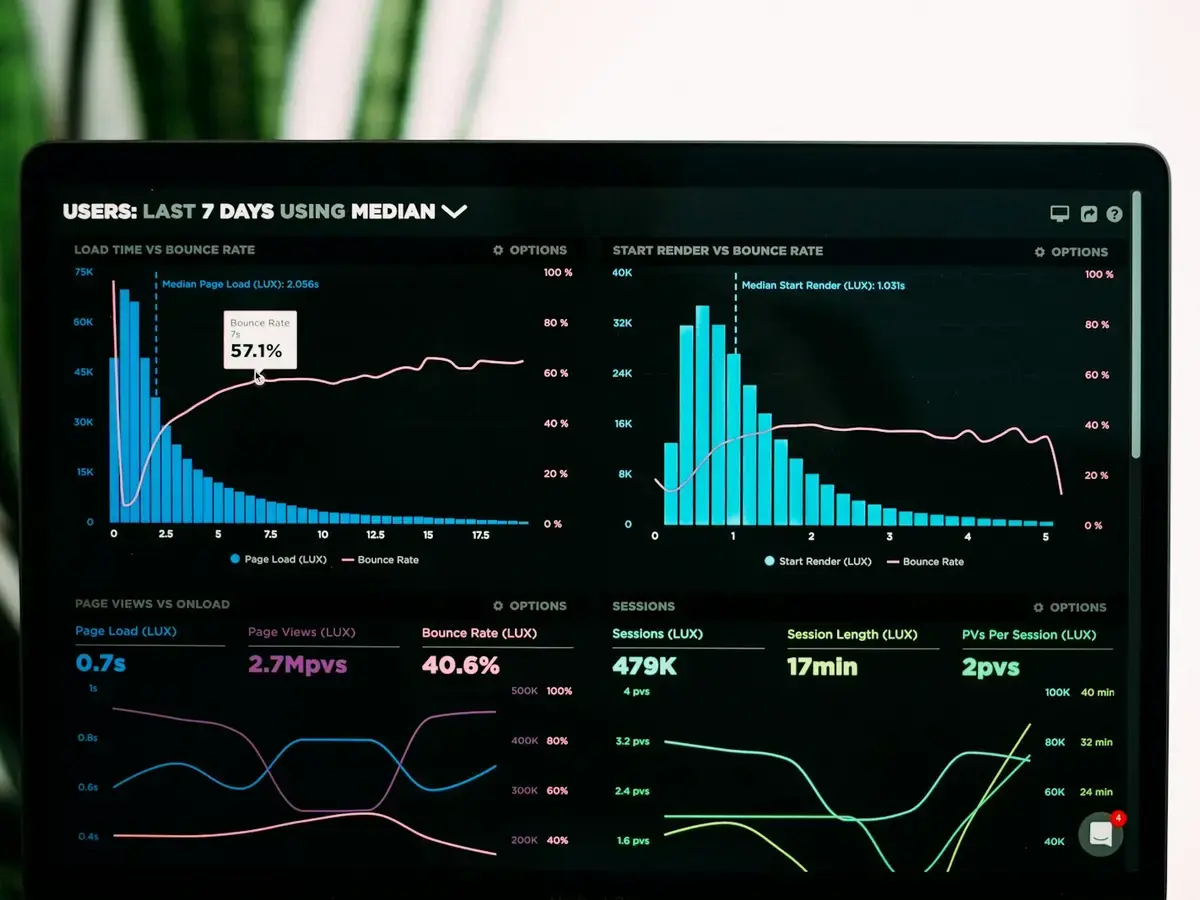
The business, visible on one screen.
- Next.js
- Postgres
- Charts & reporting
- Role-based access
The challenge
Operations data usually lives in five tools and one overworked spreadsheet. Owners make decisions on gut feel because assembling the numbers takes half a day — so it happens once a quarter instead of every morning.
How we approach it
- 1
Start from the decisions the dashboard must support, not the data that happens to exist.
- 2
Design the hierarchy: the three numbers that matter on top, drill-downs beneath.
- 3
Connect the real sources — payments, bookings, forms, internal tools.
- 4
Make it fast and mobile-friendly, because owners check numbers at odd hours.
- 5
Add role-based views so each team member sees what they need.
What a typical build includes
- Real-time KPI dashboard with drill-down views
- User, content, and operations management
- Payment and revenue reporting
- Role-based access control
- Exports and scheduled summary emails
We never publish client names, screenshots, or numbers without written permission — this walkthrough is representative of engagements in this category. Relevant private examples can be shared on a call.
Let’s talk
Ready to build something serious?
Tell us what you want to build. We’ll help you turn it into a clear, premium, and scalable digital experience.
- Direct access to the people who build
- Weekly progress updates in plain English
- You own everything we create